Bordeaux in data: maps, a radar, and a vintage that writes itself
bordeaux.guru začínal jako web s degustačními zápisky z En Primeur — tedy z ochutnávek vín, která ještě zrají v sudech. Skóre, texty, château. Jenže víno není jen chuť ve sklenici: je to výsledek počasí, půdy a rozhodnutí, která vinař udělal v konkrétní den konkrétního roku. A přesně tahle část na webu chyběla.
Tohle je první díl série Stavíme bordeaux.guru. Za pět dní práce v tandemu s AI vznikla celá datová vrstva — a ta poslední věc, kterou jsme postavili, se od té doby píše sama.
Nejdřív mapy: patnáct apelací, které nejsou placka
Chtěl jsem mapy, které nejsou dekorace. Takže žádné obrázky apelací, ale skutečné hranice — a nad nimi vrstvy, mezi kterými se dá přepínat.
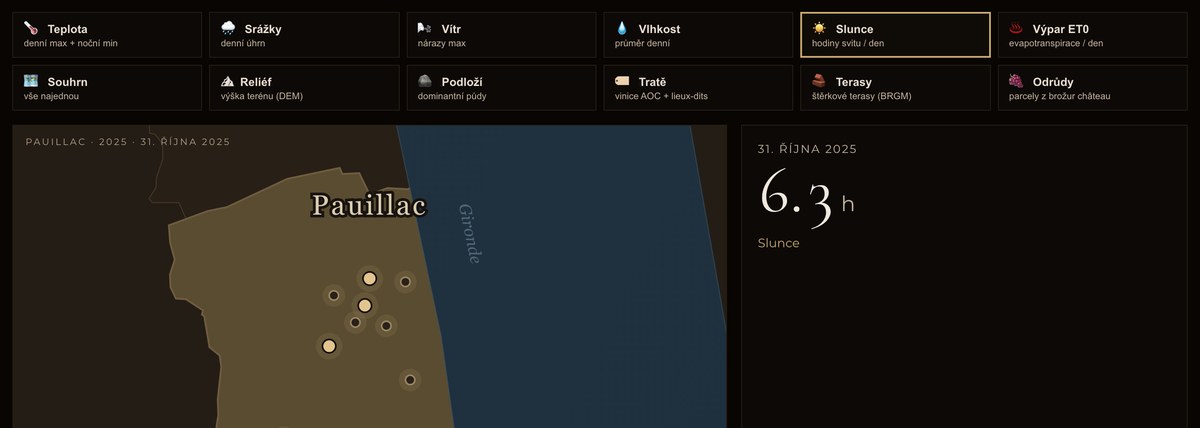
Dvanáct vrstev, jednotné legendy a škály napříč všemi apelacemi — protože srovnatelnost je celé kouzlo. Co v nich je:
- Počasí den po dni — teplota, srážky, vítr, vlhkost, sluneční svit a výpar. Sezóna se dá přehrát jako film, den po dni od dubna do října.
- Reliéf — reálný výškový model (Copernicus DEM). Médoc je plochý, 0 až 45 metrů; pravý břeh se zvedá na 111 metrů vápencového plata. Ty vyvýšeniny, croupes, rozhodují o odvodnění — a v mokrých letech o rozdílu mezi 89 a 95 body.
- Tratě — jmenované viniční polohy z francouzského katastru (Pauillac jich má 236: Bages, Batailley…) přes oficiální vymezení viničních parcel INAO.
- Terasy a podloží — štěrkové terasy podle geologických map BRGM, dominantní půdy z naší databáze.
- Odrůdy po parcelách — kde který keř roste. To je ta nejtěžší část, k ní se dostanu za chvíli.
Klimatická databáze: 9 veličin, 15 apelací, každý den sezóny
Pod mapami běží tabulka, do které jsme uložili denní klima pro každou apelaci: maximální, minimální a průměrná teplota, srážky, vítr, vlhkost, hodiny slunečního svitu, evapotranspirace a sluneční radiace. Zdroj je ERA5, evropská klimatická reanalýza — model, který dopočítává počasí zpětně na základě všech dostupných měření a sahá do roku 1940.
Klíčové rozhodnutí, které padlo hned na začátku: data se ukládají do databáze, ne jen stahují při buildu. Důvod je jednoduchý — chci se jich umět kdykoliv zpětně zeptat. Až se někdo zeptá, proč má konkrétní víno konkrétní skóre, chci umět odpovědět daty o kvetení, mrazících a suchu v tom roce.
Později přibyla ještě vlhkost půdy ve dvou hloubkách — povrch (0–7 cm) a kořenová zóna (28–100 cm). ERA5 ji poskytuje jen po hodinách, takže se stahují hodinová data a průměrují na dny. A hned první pohled do nich vyprávěl příběh: v srpnu 2026 je povrch v Pauillacu nejsušší ze všech tří měřených let, ale kořenová zóna drží víc vody než loni. Přesně to je datový důkaz vinařské poučky, že staré vinice s hlubokými kořeny suchý rok ustojí — a mladé výsadby trpí.
Radar ročníku: stránka, která se píše sama
Nejzajímavější věc vznikla jako poslední. Sezóna zrání běží právě teď, tak proč nemít stránku, která průběžně ukazuje, jak se letošnímu ročníku daří?
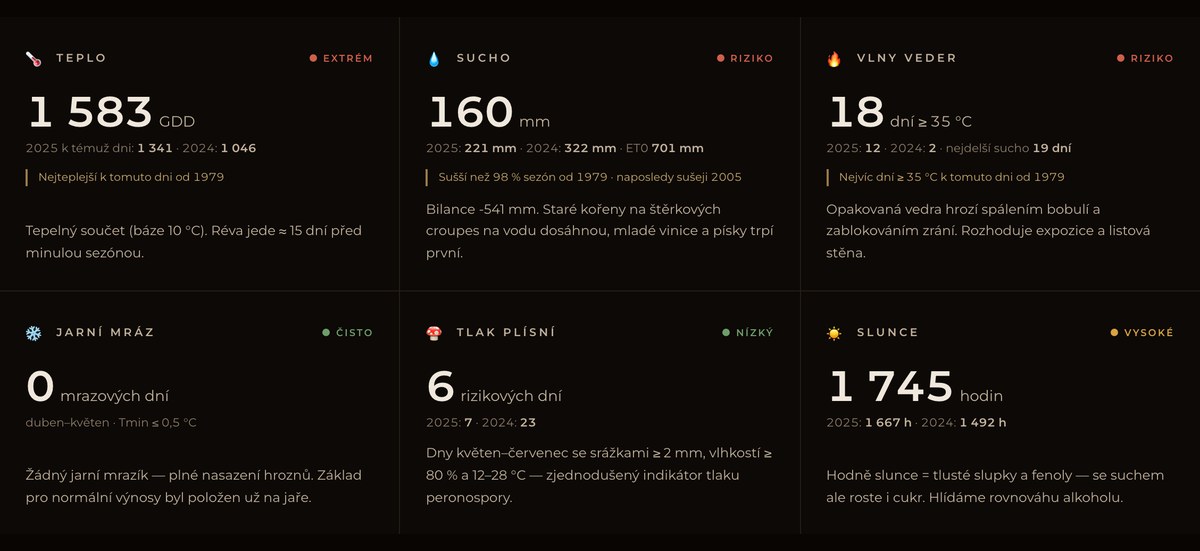
Šest signálů, každý se stavem a s výkladem, co znamená pro hrozen. A čísla, která letos vyšla, jsou samy o sobě zpráva:
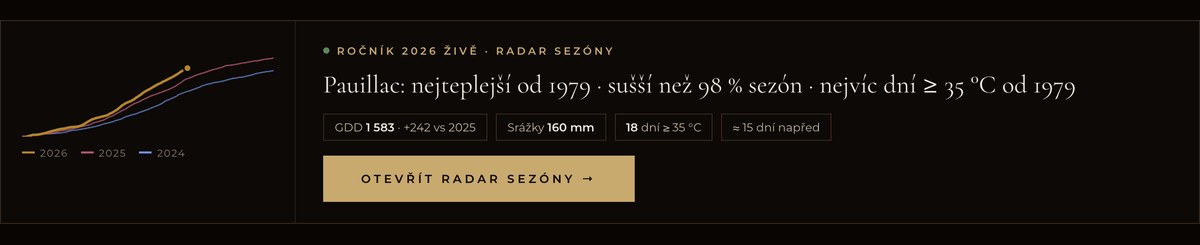
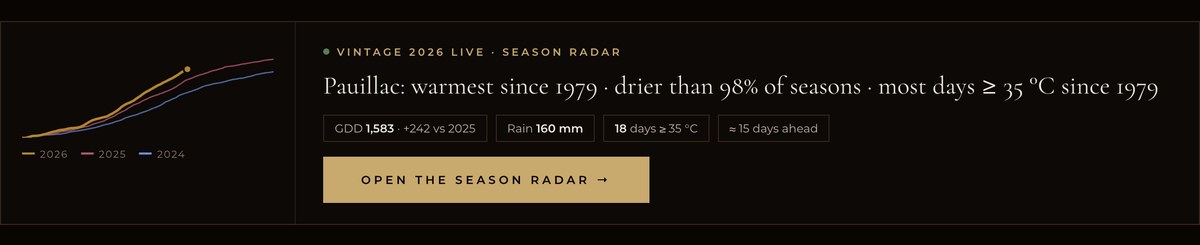
- Nejteplejší sezóna od roku 1979 — 1 583 růstových stupňů proti 1 341 loni a 1 046 předloni ke stejnému dni.
- 18 dní nad 35 °C, zatímco dosavadní rekord od roku 1979 byl devět. Réva jede zhruba patnáct dní napřed.
- Sušší než 98 % sezón od roku 1979 — 160 mm srážek proti 701 mm výparu. Naposledy bylo takhle sucho v roce 2005.
- A zároveň: žádný jarní mráz a jen šest rizikových dní pro plísně (v deštivém roce 2024 jich bylo 23). Hrozen jde do sklizně mimořádně zdravý.
Tahle historická srovnání nejsou odhad. Stáhli jsme 47 sezón zpětně (1979–2025) a počítáme percentily vždy k témuž dni sezóny — porovnávat srpen s celým rokem by byl nesmysl. Takže když stránka napíše „nejteplejší od roku 1979", je to spočítané, ne pocit.
K tomu čtrnáctidenní předpověď z ECMWF, která se načítá živě přímo v prohlížeči, a fenologie — kdy réva kvetla, kdy zaměkla, kdy se sklízí. Rok 2025 máme doložený z oficiálních brožur château, letošek zatím odhadujeme z tepelného náskoku a poctivě to označujeme šrafovaně, dokud to nedoložíme.
Data, která nejsou, a data, která nikdo nedá
Nejpoučnější část celé práce byl průzkum zdrojů. Ukázalo se, že:
- Klima je otevřené — ERA5 přes Open-Meteo, desítky let zpět, zdarma, s uvedením zdroje.
- Hranice, tratě, geologie a výškopis jsou otevřené — francouzský katastr (Etalab), viniční parcely INAO přes IGN, geologické mapy BRGM, Copernicus DEM. Vše pod otevřenou licencí.
- Odrůdy po parcelách veřejně NEJSOU. Francouzský viniční registr CVI je daňové tajemství; žádost o zpřístupnění byla zamítnuta. Jediný zdroj jsou sama vinařství.
Takže jsme šli cestou, kterou nikdo neobejde: digitalizovat parcelové mapy z oficiálních brožur château. Fotka mapy z brožury, narovnání perspektivy, vzorkování barev odrůd, trasování parcel, georeferencování na skutečné souřadnice, kontrolní dávka ke schválení. Zatím dvě panství — Gazin v Pomerolu (19 parcel) a Brane-Cantenac v Margaux (93 parcel). Každý údaj je označený jako „údaje château", zákres je poctivě popsaný jako orientační.
Mimochodem — právě tahle data jsou důvod, proč má web dvouúrovňový přístup. Otevřená data zůstávají veřejná s atribucí; to, co jsme sami pořídili, je za členstvím. S jednou výjimkou: první digitalizované panství necháváme jako ukázku zdarma. Kdo chce vidět, jak to vypadá, ať to vidí.
Terroir jako deset signálů — a co z nich plyne pro hrozen
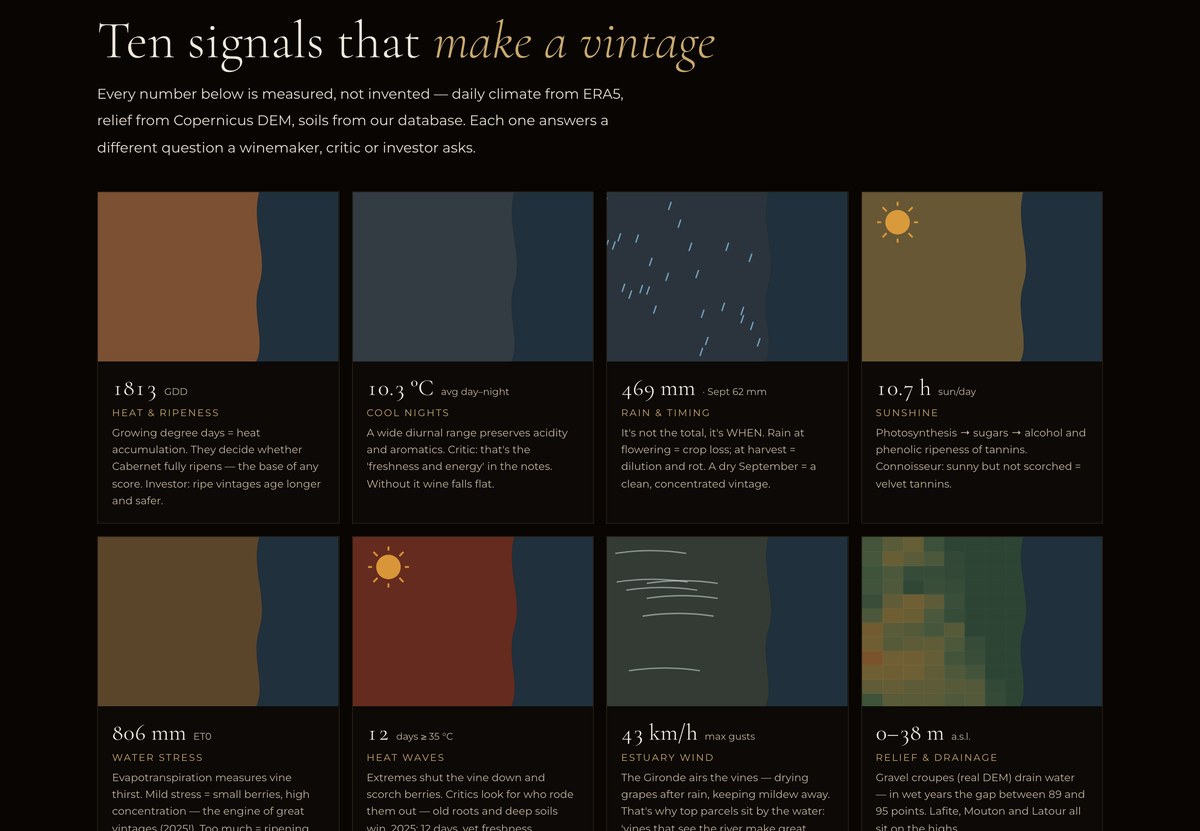
Sebelepší graf je k ničemu, když u něj nestojí, co znamená. Proto má stránka o terroiru deset signálů — každý je mini-mapa z reálných dat, číslo a věta, proč rozhoduje. Ne pro meteorologa: pro člověka, který chce vědět, jestli si to víno koupit.
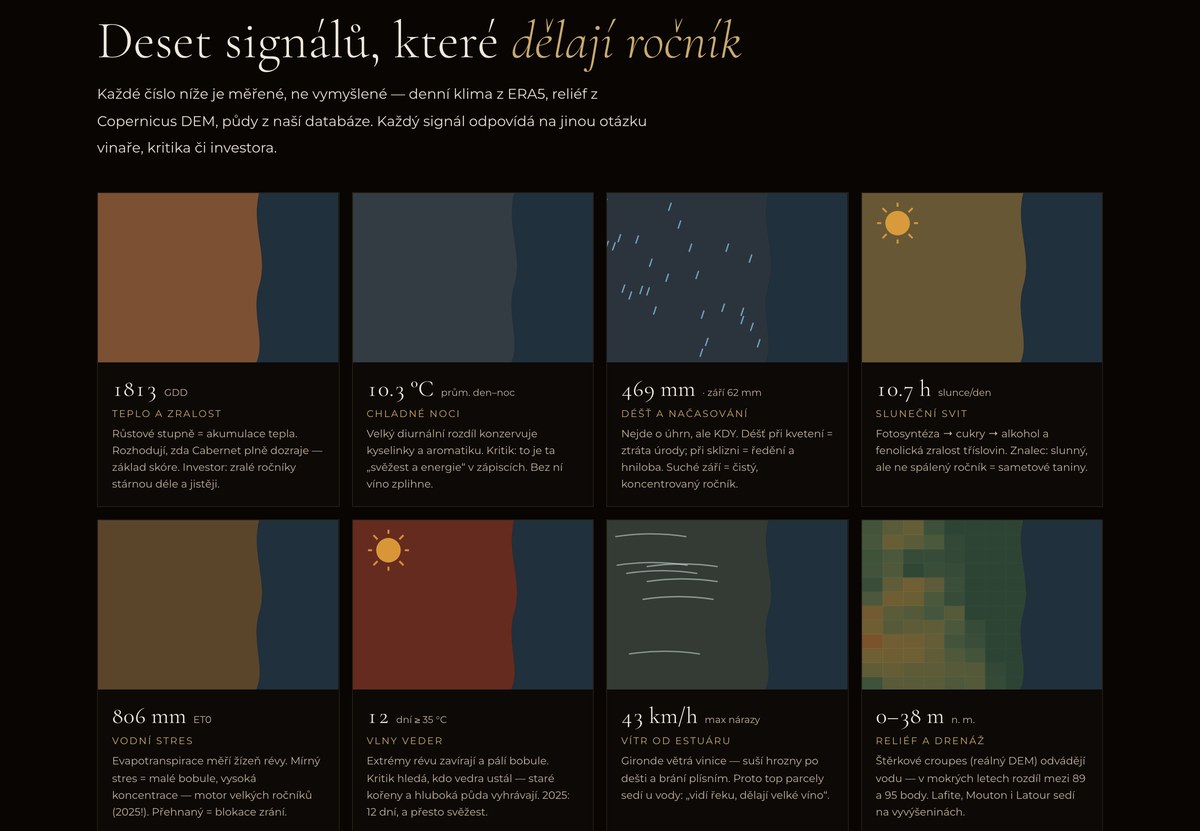
A protože sezóna běží, přibyla i upoutávka, která ukazuje aktuální ročník proti dvěma předchozím — na titulce i na terroiru:
Co mě na tom baví nejvíc: běží to samo
Celá klimatická vrstva by byla k ničemu, kdyby ji někdo musel každý týden ručně aktualizovat. Takže se aktualizuje sama: naplánovaná úloha jednou týdně stáhne čerstvá data a zapíše je do databáze. Skript má jediné právo — psát do jedné tabulky s klimatem, nikam jinam. Když stahování selže, databáze zůstane nedotčená.
A mezi běhy? ERA5 má zhruba pětidenní zpoždění, takže posledních pár dní si stránka dopočítá živě z předpovědního modelu a označí je. Radar je tak vždy aktuální ke dnešku, i když databáze o pár dní zaostává.
Poučení, která bych si chtěl zapamatovat
- Definice jsou důležitější než výpočet. „Tepelný náskok proti loňsku" se dá spočítat dvěma způsoby — a jeden z nich mi vycházel 27 dní místo 15, protože akumulace tepla v září je pomalá a dělením malým číslem se chyba nafoukne. Rozdíl nebyl v kódu, ale v tom, co přesně měřím.
- 404 neznamená „neexistuje". Testoval jsem, jestli je jedna vrstva nasazená, dostal 404 a napsal, že hotová není. Přitom byla — jen se mezitím přesunula za autorizační bránu na jinou adresu. Když ověřuješ funkci, hledej v kódu, kam si o data sám říká, a testuj tu cestu.
- FTP ti tiše zapomene soubory. Po jednom nasazení se stránky tvářily prázdně: chybělo pár souborů s kódem, protože přenos je vynechal. Od té doby po každém nahrání koukám na chybové požadavky v prohlížeči.
- Poctivost se musí navrhnout do UI. Odhad je vždy šrafovaný a označený, zdroj se uvádí, a co neumíme spočítat (krupobití), tak nepublikujeme. Data o víně budou jednou vstupem pro AI asistenta — a ta si nesmí splést naměřené s odhadnutým.
Co z toho plyne dál
Tohle nebyla práce na hezčí web. Byla to příprava terénu: v databázi teď leží tisíce dní klimatu, výškopis, půdy, parcely a fenologie — všechno provázané na konkrétní vína a château. Nad tím vzniká asistent, který na otázku „proč má tohle víno tohle skóre" umí odpovědět daty o tom, jak probíhala sezóna.
A sezóna 2026 se zatím píše sama: nejteplejší od roku 1979, sušší než 98 % sezón, hrozen zdravý. Jestli bude velká, rozhodne září.
Radar ročníku je veřejný na bordeaux.guru/season, mapy na bordeaux.guru/maps. Zdroje dat: Copernicus ERA5 přes Open-Meteo, Copernicus DEM, IGN/INAO, Etalab (DGFiP), BRGM. Máte-li vlastní zkušenost se stavěním datových vrstev nad otevřenými zdroji, napište mi na LinkedIn.
', 'cs', 0, NULL, N'/assets/blog/bordeaux-v-datech-cover.jpg', N'bordeaux-in-data-maps-radar-weather', N'- Živé mapy 15 apelací — 12 přepínatelných vrstev: počasí den po dni, reliéf z Copernicus DEM, tratě z katastru, geologické terasy, odrůdy po parcelách. Jednotné škály napříč apelacemi.
- Klimatická databáze — 9 veličin denně z ERA5 pro každou apelaci, včetně vlhkosti půdy ve dvou hloubkách. Uloženo v DB, ne jen stahováno — aby se dalo kdykoli zpětně ptát.
- Radar ročníku 2026 — šest signálů, 14denní předpověď a percentily proti 47 sezónám (1979+). Letos: nejteplejší od 1979, 18 dní nad 35 °C, sušší než 98 % sezón. Aktualizuje se sám jednou týdně.
- Odrůdy po parcelách veřejně neexistují (francouzský registr CVI je daňové tajemství) — jediná cesta je digitalizovat mapy z brožur château. Zatím Gazin a Brane-Cantenac.
bordeaux.guru started as a site for En Primeur tasting notes — wines tasted while they still age in barrel. Scores, texts, châteaux. But wine is not just the flavour in the glass: it is the result of weather, soil, and decisions a winemaker made on a specific day of a specific year. And that part was missing.
This is part one of the Building bordeaux.guru series. Five days of work in tandem with AI produced an entire data layer — and the last thing we built has been writing itself ever since.
Maps first: fifteen appellations that are not flat
I wanted maps that are not decoration. So no pictures of appellations, but real boundaries — with switchable layers on top of them.
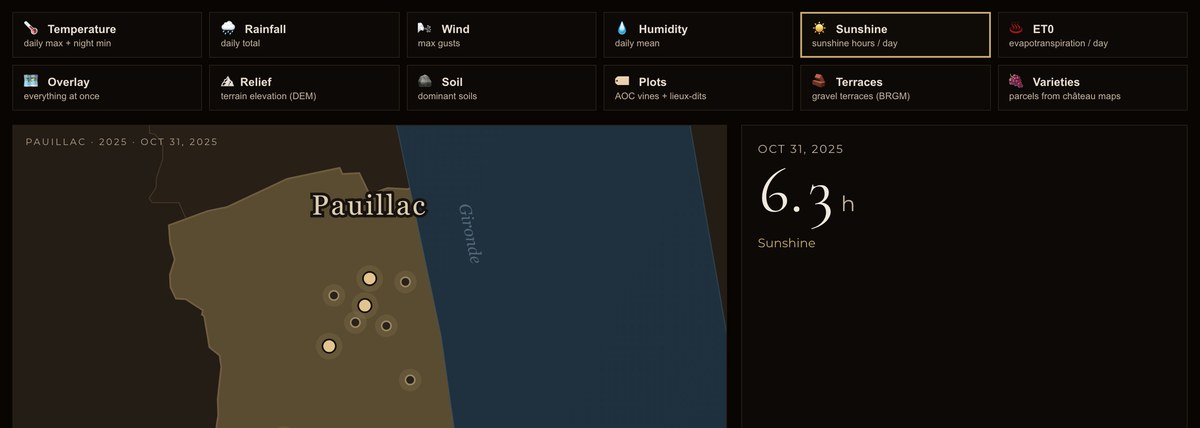
Twelve layers, with one shared legend and scale across every appellation — because comparability is the whole point. What is in them:
- Weather day by day — temperature, rainfall, wind, humidity, sunshine hours and evapotranspiration. A season can be played back like a film, day by day from April to October.
- Relief — a real elevation model (Copernicus DEM). The Médoc is flat, 0 to 45 metres; the right bank climbs to 111 metres of limestone plateau. Those rises, the croupes, decide drainage — and in wet years, the gap between 89 and 95 points.
- Named plots — historic vineyard place names from the French cadastre (Pauillac has 236 of them: Bages, Batailley…) over the official INAO delimitation of vineyard parcels.
- Terraces and soils — gravel terraces from BRGM geological maps, dominant soils from our database.
- Grape varieties parcel by parcel — which vine grows where. That is the hardest part; more on it in a moment.
The climate database: 9 variables, 15 appellations, every day of the season
Under the maps sits a table holding daily climate for every appellation: maximum, minimum and mean temperature, rainfall, wind, humidity, sunshine hours, evapotranspiration and solar radiation. The source is ERA5, the European climate reanalysis — a model that reconstructs past weather from all available measurements and reaches back to 1940.
One decision was made right at the start: store the data in the database, do not just fetch it at build time. The reason is simple — I want to be able to ask it questions later. When someone asks why a particular wine earned a particular score, I want to answer with data about flowering, frost and drought in that year.
Later came soil moisture at two depths — topsoil (0–7 cm) and the root zone (28–100 cm). ERA5 only provides it hourly, so we fetch hourly data and average it into days. The very first look at it told a story: in August 2026 the topsoil in Pauillac is the driest of all three measured years, yet the root zone holds more water than last year. That is the data proof of the old wine adage that old vines with deep roots ride out a dry year — and young plantings suffer.
The vintage radar: a page that writes itself
The most interesting thing came last. The ripening season is running right now, so why not have a page that continuously shows how this vintage is doing?
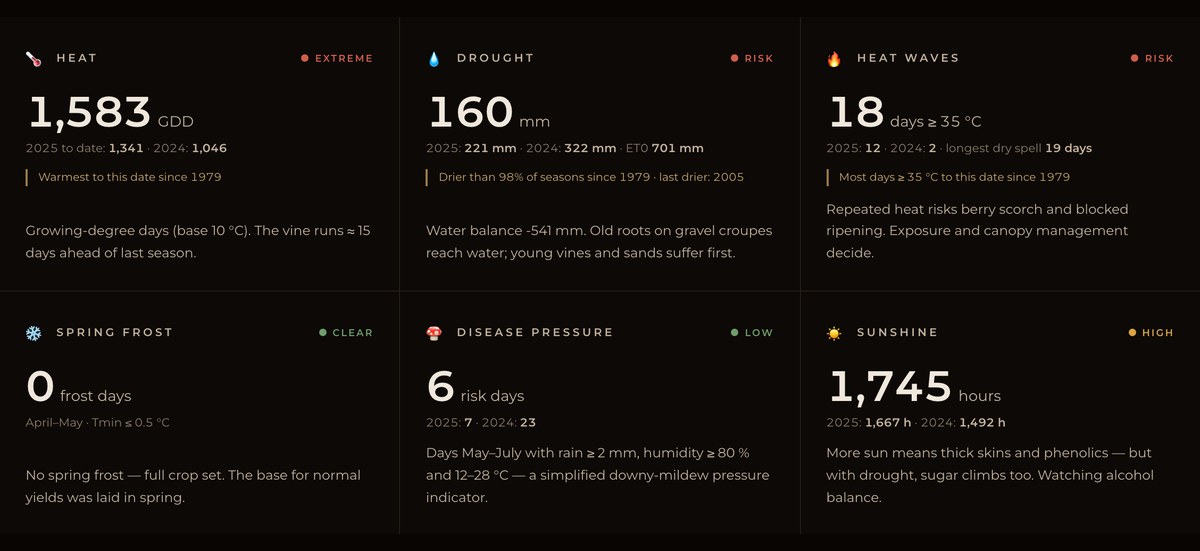
Six signals, each with a status and a reading of what it means for the fruit. And this year the numbers are a story in themselves:
- The warmest season since 1979 — 1,583 growing degree days against 1,341 last year and 1,046 the year before, to the same date.
- 18 days above 35 °C, where the record since 1979 was nine. The vine is running roughly fifteen days ahead.
- Drier than 98 % of seasons since 1979 — 160 mm of rain against 701 mm of evapotranspiration. The last time it was this dry was 2005.
- And at the same time: no spring frost and only six disease-risk days (the wet 2024 had 23). The fruit heads into harvest exceptionally healthy.
These historical comparisons are not estimates. We pulled 47 seasons back (1979–2025) and compute percentiles always to the same day of the season — comparing August with a full year would be nonsense. So when the page says "the warmest since 1979", it is computed, not felt.
On top of that: a fourteen-day ECMWF forecast loaded live in the browser, and phenology — when the vine flowered, when veraison happened, when picking starts. 2025 is documented from official château brochures; this year we still estimate from the thermal lead and honestly mark it hatched until we can confirm it.
Data that does not exist, and data nobody will give you
The most instructive part of the whole job was the source research. It turned out that:
- Climate is open — ERA5 via Open-Meteo, decades back, free, with attribution.
- Boundaries, plots, geology and elevation are open — the French cadastre (Etalab), INAO vineyard parcels via IGN, BRGM geological maps, Copernicus DEM. All under open licences.
- Parcel-level grape varieties are NOT public. The French vineyard register (CVI) is protected by fiscal secrecy; a request to open it was refused. The estates themselves are the only source.
So we took the one road nobody can shortcut: digitising parcel maps from official château brochures. Photograph the map, correct the perspective, sample the variety colours, trace the parcels, georeference them onto real coordinates, then a control batch for approval. Two estates so far — Gazin in Pomerol (19 parcels) and Brane-Cantenac in Margaux (93 parcels). Every figure is labelled "château data" and the rendering is honestly described as indicative.
Incidentally, this data is exactly why the site has two access levels. Open data stays public with attribution; what we acquired ourselves sits behind membership. With one exception: the first digitised estate stays free as a sample. If someone wants to see what it looks like, let them see it.
Terroir as ten signals — and what they mean for the grape
The best chart is useless if nothing next to it says what it means. So the terroir page carries ten signals — each a mini-map from real data, a number, and a sentence on why it decides. Not for a meteorologist: for someone deciding whether to buy the wine.
And since the season is running, a teaser now shows the current vintage against the two previous ones — on the homepage and on the terroir page:
What I enjoy most: it runs on its own
The whole climate layer would be worthless if someone had to refresh it manually every week. So it refreshes itself: a scheduled task pulls fresh data once a week and writes it into the database. The script has exactly one privilege — writing into the single climate table, nowhere else. If the download fails, the database is left untouched.
And between runs? ERA5 lags by about five days, so the page fills the last few days live from the forecast model and marks them. The radar is therefore always current as of today, even when the database is a few days behind.
Lessons I want to remember
- Definitions matter more than the calculation. "Thermal lead against last year" can be computed two ways — and one of them gave me 27 days instead of 15, because heat accumulation in September is slow and dividing by a small number inflates the error. The difference was not in the code, but in what exactly I was measuring.
- A 404 does not mean "does not exist". I tested whether a layer was deployed, got a 404, and reported it was not done. It was — it had just moved behind an authorisation gate to a different address. When you verify a feature, find in the code where it actually asks for its data, and test that path.
- FTP will quietly forget your files. After one deployment the pages looked empty: a few code files were missing because the transfer skipped them. Ever since, I check the browser's failed requests after every upload.
- Honesty has to be designed into the UI. An estimate is always hatched and labelled, the source is always named, and what we cannot compute (hail) we do not publish. This data will one day feed an AI assistant — and it must never confuse measured with estimated.
What follows from all this
This was not work on a prettier website. It was groundwork: the database now holds thousands of days of climate, elevation, soils, parcels and phenology — all tied to specific wines and châteaux. On top of it we are building an assistant that can answer "why does this wine have this score" with data about how the season actually went.
And the 2026 season is writing itself so far: the warmest since 1979, drier than 98 % of seasons, healthy fruit. Whether it turns out great will be decided in September.
The vintage radar is public at bordeaux.guru/season, the maps at bordeaux.guru/maps. Data sources: Copernicus ERA5 via Open-Meteo, Copernicus DEM, IGN/INAO, Etalab (DGFiP), BRGM. If you have your own experience building data layers on open sources, message me on LinkedIn.
Addendum, 11 September: what has been added in three weeks
I wrote this text in mid-August, and the database has changed enough since then that the numbers in it would now mislead. So here is what has been added — because that is precisely what this work is: data does not get finished, it keeps being collected.
There are now 284 tastings instead of the 145 back then. That splits into 169 en primeur notes from the barrel and 115 from the bottle. The second half is new: we used to publish only what we tasted from barrel in Bordeaux each spring, and now bottles opened at home are being added — wines at the moment someone actually drinks them. They are two different things and the site does not mix them.
Hard technical data straight from the châteaux has arrived. From the 2025 technical sheets I now hold the blend, alcohol, pH, yield per hectare, share of new oak, ageing time and harvest dates for 110 wines. That is the kind of figure that used to be guessed from an impression in the glass — and it is exactly what allowed me, a month later, to disprove the widespread theory that Michelin punishes new oak. More on that in part three.
Pages have started growing out of the data itself. "The wine year" walks through the season from bud to bottle, taking harvest dates from individual châteaux' technical sheets. A quiz on classifications tests whether a reader can tell an 1855 growth from a Saint-Émilion tier. And "My cellar" with a wishlist works out what a member paid for their bottles at the Czech National Bank rate on the purchase date, and how that compares with today's quotes — it is editorial record-keeping, not investment advice, and we do not hold per-wine market prices and do not claim to.
The 2026 vintage radar has meanwhile kept running on its own. The season in Pauillac closed at 214 days of measurement, and the autumn will decide whether the wine in the glass confirms what those numbers say about an exceptional year. That, though, is material for another text.